Posted on March 2, 2017 by pollutionfree
Congestion Pricing, Air Pollution, and Urban Health (11 page pdf, Emilia Simeonova, Janet Currie, Peter Nilsson and Reed Walker, American Economics Association Meeting, Chicago, Jan. 2017)
Also discussed here: Driving Fee Rolls Back Asthma Attacks in Stockholm (Nala Rogers, Inside Science. Feb. 2, 2017)
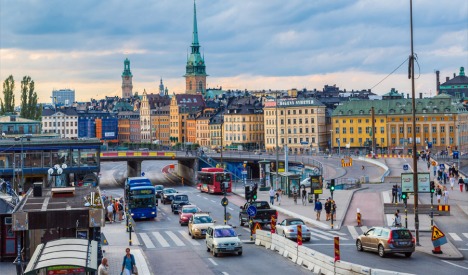
Today we review research on the impact of the introduction of congestion pricing in Stockholm, in 2006, and the reduction of traffic that followed on the health of children in that city. Pollution levels in that city are lower than EPA’s standards. Results indicate that the pricing system caused a drop in traffic volumes by 25%, reductions in NO2 and particulate (PM10) pollution of 5 and 10% and a reduction in asthma cases by 12% in the first seven months which increased to 45% over the longer term (several years). While the benefits in other cities with fewer diesel vehicles (emitting PM) may not be as great, it is clear that there are benefits even when the air quality in a given city (such as Ottawa) is considered “good” and that there are negative health impacts that begin at lower thresholds than EPA standards project.
To see Key Quotes and Links to key reports about this post, click HERE
Filed under: Health Impacts, PRICING, Urban Traffic | Tagged: health, pollution, pricing | Leave a comment »
Posted on February 28, 2017 by pollutionfree
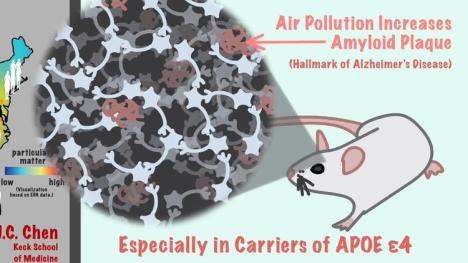
Particulate air pollutants, APOE alleles and their contributions to cognitive impairment in older women and to amyloidogenesis in experimental models (8 page pdf, M Cacciottolo, X Wang, I Driscoll, N Woodward, A Saffari, J Reyes, M L Serre, W Vizuete, C Sioutas, T E Morgan, M Gatz, H C Chui, S A Shumaker, S M Resnick, M A Espeland, C E Finch and J C Chen, Translational Psychiatry, Jan. 31, 2017)
Also discussed here: Air pollution may cause 21 percent of dementias worldwide, study suggests (The San Diego Union-Tribune, Feb. 1, 2017)
And here: Early Onset Familial AD (Gabrielle Strobel, ALZFORUM)
Today we review research based on longer term exposure by female mice to PM 2.5 and how this could affect older women exposed to traffic-related air pollution in their risks of having dementia. Results indicate that women in the late 60s and 70s are 92% more likely to develop dementia if they live in areas that exceed EPA’s standards for PM2.5. The increase in the elderly and the greater risk of dementia has resulted in an overall increase in this disease, despite the improvements in levels of PM 2.5 over the last decade or two, as well as in the increase of deaths from Alzheimer’s, the sixth leading cause of death nationwide.
To see Key Quotes and Links to key report about this post, click HERE
Filed under: Health Impacts, Urban Traffic | Tagged: health, traffic | Leave a comment »
Posted on February 23, 2017 by pollutionfree
An integrated approach for estimating greenhouse gas emissions from 100 U.S. metropolitan areas (12 page pdf, Samuel A Markolf, H Scott Matthews, Inês L Azevedo and Chris Hendrickson, Environmental Research Letters, Jan. 25, 2017)
Today we review an approach to estimate the emissions for a large number of cities in the USA which has advantages over the traditional bottom-up approach as well as likely being more accurate because it includes production as well as consumption of carbon emissions and fuels. Emissions from individual cities ranged from 5 metric tons per person in Tucson to 65 meteric tons per person in New Orleans. In gross terms, the average emission for the 100 cities examined was 27 million metric tons per year.

Per capita responsibility for current atmospheric CO 2 level, including land-use change (Photo credit: Wikipedia)
To see Key Quotes and Links to key reports about this post, click HERE
Filed under: Environmental Plans, Monitoring Networks, Standards/Regulations | Leave a comment »
Posted on February 21, 2017 by pollutionfree
Hoping for a fresh sea breeze aboard a cruise ship? Better hold your nose! (Karin Jäger, DW Environment, Jan. 26, 2017)
Also discussed here: NABU Cruise Rankings 2016 : Cruise ships fall short in environmental protection (MARES, Sep. 1, 2016)
And here: This stinks! – Clean up cruise ships! NABU’s campaign for a cleaner cruise industry (10 page pdf, NABU Background Cruise Ships, 2015))
And here: NABU measures air pollution in ports (NABU)
And here: Scrubbers – An economic and ecological assessment (45 page pdf, Eelco den Boer, Maarten ‘t Hoen, DELFT for Naturschutzbund Deutschland (NABU), Mar. 13, 2015)
And here: The 0.1% sulphur in fuel requirement as from 1 January 2015 in SECAs (30 page pdf, European Maritime Safety Agency, Dec. 13, 2010)
Today we review examples of pollution from cruise ships both in port and now with previously never measured pollution, at sea. One ship emits as much air pollution over the same distance travelled as 5 million cars. 38% of the NO2 and 19% of particulates in the major German cruise ship port, Hamburg, comes from maritime traffic. Only 80 ships out of 55,000 worldwide have scrubbers installed to reduce the back soot emitted. Most of the 14,000 ships sailing in European SECAs < Sulphur Emission Control Areas> every year switched to low sulphur fuels instead of installing scrubbers. The UN, through the International Maritime Organisation (IMO), has the mandate to regulate the maritime environment internationally through its International Convention for the Prevention of Pollution from Ships (so-called MARPOL protocol).

To see Key Quotes and Links to key reports about this post, click HERE
Filed under: Monitoring Networks, Standards/Regulations | Tagged: emissions, pollution, transportation | Leave a comment »
Posted on February 16, 2017 by pollutionfree
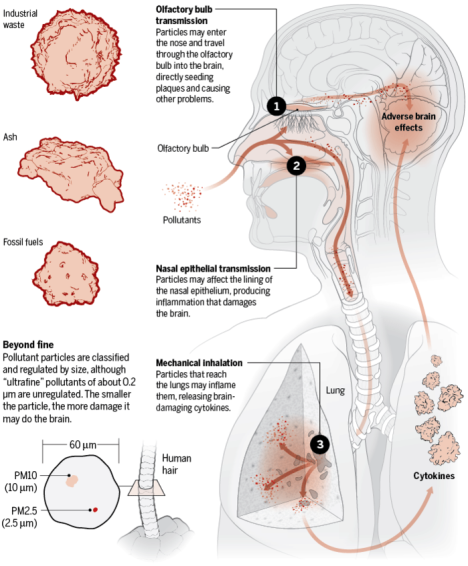
The Polluted Brain – Evidence Builds that Dirty Air Causes Alzheimer’s, Dementia (AAAS Science, Emily UnderwoodJan. 26, 2017)
Also discussed here: Particulate Air Pollutants and White Matter Brain Aging (Abstract, Jiu-Chiuan Chen, Xinhui Wang, Mark A. Espeland, Helena Chui, Alzheimer’s and Dementia, Jul. 2014)
And here: Traffic-related air pollution and brain development (21 page pdf, Nicholas Woodward, Caleb E. Finch and Todd E. Morgan , AIMS Environmental Science. May 6, 2015)
Today we review a series of research articles that reaffirm the health risks presented to people (and mice) who breathe in air polluted by vehicles and containing ultra-fine particles, in particular. Signs of memory loss and Alzheimer’s are evident in mice exposed to UFP. Levels of fine air particles within 50 m of major roadways are 10 times higher than at 150 m and those within 50 m stand a 12% higher risk of developing dementia. Tests involving prenatal mice showed that fetal damage can be done by fine particles without entering the placenta. The closer people live to major roadways, the smaller their celebral brain volume. What more do city planners and public health officials need to know about running highways and traffic through cities?
To see Key Quotes and Links to key reports about this post click HERE
Filed under: Health Impacts, Urban Traffic | Tagged: health, pollution, traffic | Leave a comment »
Posted on February 14, 2017 by pollutionfree
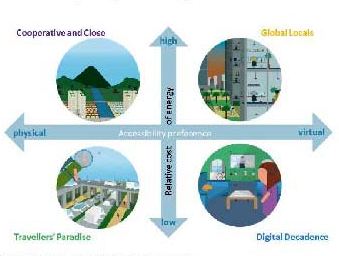
What will the local transport system look like in 2045? The future local transport system (David Levinson, Transportist, Dec.19, 2016)
Also discussed here: What key factors do you see driving these changes over the next 30 years? (David Levinson, Transportist, Dec.19, 2016)
And here: Future Demand – New Zealand transport and society: Scenarios to 2042 (23 page pdf, New Zealand Government, Nov. 2014)
Today we review an interview on the future local transportation with Marcus Enoch by David Levinson and a report looking ahead to 2042 as part of New Zealand project PT2045. Enoch sees the automation of vehicles, their conversion to electric and the rise of shared mobility, as opposed to owning a vehicle, as the three most important changes. There will be a lot more single passenger, two wheeled e-cars and goods will be delivered by robot cars. Manually driven cars on public roads will be prohibited in 25 years. Urban congestion will end before 2042 with fewer, if any, private vehicles on the road. Carbon emissions will fall dramatically.
To see Key Quotes and Links to key reports about this post, click HERE
Filed under: Urban Traffic | Tagged: future, pricing, traffic, transportation | Leave a comment »
Posted on February 9, 2017 by pollutionfree
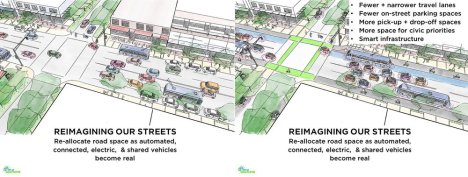
Turning Transportation Challenges and Opportunities Presented to the City of Vancouver by Autonomous Vehicles (93 page pdf, Cail Smith, Greenest City Scholars Report, Aug. 31, 2016)
Also discussed here: Vancouver Prepares For a Driverless Future That Includes Extra Space for Walking, Cycling, and Transit (Mobility, Jan. 17, 2017)
And here: Transportation 2040 Plan: A transportation vision for the City of Vancouver (City of Vancouver)
And here: Transportation 2040 (99 page pdf, Plan as adopted by Vancouver City Council, Oct.31, 2012)
Today we review plans and reports aimed at the future of Vancouver in 2040 which may include a transition to driverless or autonomous vehicles (AV) as well as meeting the target of having 2/3 of all trips made on foot, by bike or transit. With a 90% AV share, freeway congestion would be reduced by 60% from present levels and 30% of city traffic would be reduced by no need to search for parking. Garages could be converted to guest houses and garage lanes to useful parks or gardens. Shifting to AVs would save the average Canadian household $2,700 per year (4% of income) by decreasing insurance, fuel and parking costs, as well as saving the City of Vancouver $15 M/yr on maintaining and monitoring parking spots, while also reducing revenue from parking tickets by $53M/yr (also 4% of net revenue).
To see Key Quotes and Links to key reports about this post, click HERE
Filed under: Environmental Plans, Standards/Regulations, Urban Traffic | Leave a comment »
Posted on February 7, 2017 by pollutionfree
Nanoparticle exposure reactivates latent herpesvirus and restores a signature of acute infection (19 page pdf, Christine Sattler, Franco Moritz, Shanze Chen, Beatrix Steer, David Kutschke, Martin Irmler, Johannes Beckers, Oliver Eickelberg, Philippe Schmitt-Kopplin, Heiko Adler and Tobias Stoeger, Particle and Fibre Toxicology, Jan. 10, 2017)
Also discussed here: Nanoparticle exposure can awaken dormant viruses in the lungs (ScienceDaily, Jan. 17, 2017)
Today we review a lab experiment on cells in mice that examined the impact of exposure to nanoparticles (NP). Results indicate that these nanoparticles can “reawaken” latent herpes viruses in the lung by weakening the immune system and allowing viruses to invade the host cell. The researchers would like to examine if these results can be transferred to humans and if so, if exposure to emissions from combustion and traffic-related emissions suggest another serious impact.

To see Key Quotes and Links to key reports about this post, click HERE
Filed under: Health Impacts, Urban Traffic | Tagged: health, particulates, traffic | Leave a comment »
Posted on February 2, 2017 by pollutionfree
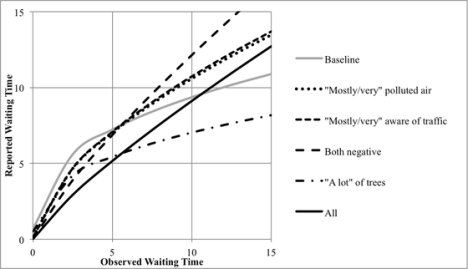
Transit Stop Environments and Waiting Time Perception Impacts of Trees, Traffic Exposure, and Polluted Air (Abstract, Marina Lagune-ReutlerRelated information, Andrew GuthrieRelated information, Yingling FanRelated information, and David Levinson, Transportation Research Record: Journal of the Transportation Research Board, Jan. 9, 2017)
Also discussed here: Transit Riders’ Perception of Waiting Time and Stops, Surrounding Environments (17 page MS Word, Marina Lagune-Reutler, Andrew Guthrie, Yingling Fan, David Levinson, Draft submitted to Transportation Research Record: Journal of the Transportation Research Board, July 2015)
Today we review research based on over 800 responses from users of public transit in Minneapolis, MN. The key factor studied was the wait times –both real and perceived- and how this varied with the type of environment found at bus and transit stops. Results indicate that polluted air and the presence of heavy traffic near the stops tended to increase the length of perceived wait time when this was over 5 minutes while the presence of trees and light traffic shortened the perceived wait time. Conclusions and recommendations to encourage more transit use include locating transit lines away from traffic and heavily polluted areas and planting trees and foliage near the stops. Canadians and those in cold climates would be heartened by the finding that more or less snow has little effect on transit users who, if anything were more likely to happy they were not driving a private car.
To see Key Quotes and Links to key reports about this post, click HERE
Filed under: Standards/Regulations, Urban Traffic | Tagged: pollution, roads, traffic, transportation | Leave a comment »
Posted on January 31, 2017 by pollutionfree
Living close to major roads linked to small increase in dementia risk (Abstract, the Lancet, Jan.4, 2017)
Also discussed here: Living near major roads is associated with increased dementia risk, study finds (Susan Mayor, The British Medical Journal, Jan. 5, 2017)
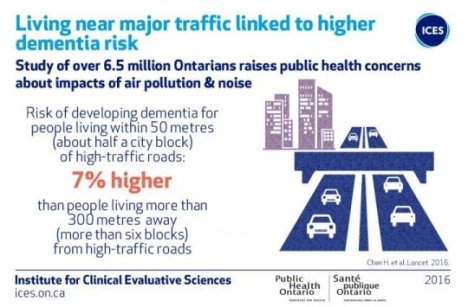
And here: Living near major traffic linked to higher risk of dementia (Public Health Ontario, Jan. 4, 2017)
And here: Does Living by a Busy Road Boost Dementia Risk? Exposure to heavy traffic tied to cognitive decline (Alexandria Bachert , MedPage Today, Jan. 4, 2017)
Today we review a study with over 6.5 million people living in Ontario that examined the impact of living near high traffic roadways and the incidence of dementia, the first time such a study has been conducted in Canada. Results indicate a 7 percent higher risk for those who live within 50m (half a city block)compared to those who live more than 200 m from these roadways who have no higher risk. The specific pollutants found responsible include PM2.5 and NO2. Interesting that other neurological disorders such as Parkinson’s disease or multiple sclerosis were found to not have a higher risk.
To see Key Quotes and Links to key reports abut this post, click HERE
Filed under: Health Impacts, Urban Traffic | Tagged: health, roads, transportation | Leave a comment »
Posted on January 26, 2017 by pollutionfree
On time and ready to go: An analysis of commuters’ punctuality and energy levels at work or school (Abstract, Charis Loong , Dea van Lierop , Ahmed El-Geneidy, Transportation Research Part F: Traffic Psychology and Behaviour, Dec. 23, 2016)
Also discussed here: Cyclists Are Winning Commuting (Andrew Small, The Atlantic City Lab, Dec. 23, 2016)
Today we review research into commuting choices made by staff and students at McGill University in Canada’s second largest city, Montreal. Although Montreal is hilly and quite cold and snowy in the winter, its cyclists and pedestrians are relatively well served by its city’s administration and policies as reflected in the infrastructure provided for pedestrians and cycling. Montreal has by far the best organized and extensive car free days each year. Montreal was the first city in Canada to have segregated bike lanes in its downtown. The study of McGill’s commuters reveals that, unlike what most people assume, commuting time per se is not the most important factor- punctuality and feeling energized on arrival are, while noting that the longest time for commutes were those taken by public transit or by private vehicle. If applicable elsewhere (and this may not be valid in cities where infrastructure is poor, where the commuters are older or where winter snow is too much of a barrier), this means that city transportation planners might have to give priority to punctuality and the benefits of arriving refreshed when deciding on improvements for commuters in their cities.

To see Key Quotes and Links to key reports about this post, click HERE
Filed under: Urban Traffic | Tagged: cycling, pedestrian, transit, transportation | Leave a comment »
Posted on January 24, 2017 by pollutionfree
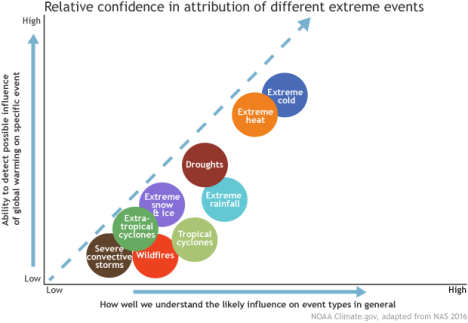
Extreme event attribution: the climate versus weather blame game (Rebecca Lindsey, NOAA Climate, Dec. 15, 2016)
Today we review a paper that describes the statistical process of attributing short term weather extreme events to the longer term changes underway as a result of climate change, whether that is due to natural or man-made burning of carbon fuels. It is important to understand the meaning of return periods. While the probability of a 100 year flood in a given year is 1%, the probability of the same flood over a period of 50 years is 40%. The blaming of an event on climate change depends on how good the observations of past events are, how well climate models can simulate the specific event and how well the physical processes are known and their association with climate change. Extended heat or cold events are more attributable than short term convective storms where the cross links are not as well understood.
To see Key Quotes and Links to key reports about this post, click HERE
Filed under: Environmental Plans, Monitoring Networks | Tagged: climate, future | Leave a comment »
Posted on January 19, 2017 by pollutionfree
Air pollution: outdoor air quality and health (National Institute for Health and Care Excellence, Dec.1, 2016)
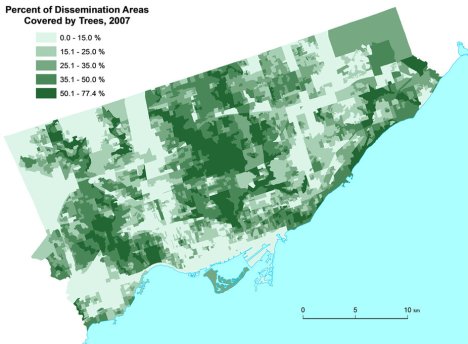
Also discussed here: Trees could make urban pollution even worse (quartz, Dec.6, 2016)
And here: Neighborhood greenspace and health in a large urban center (Nature, Scientific Reports, Jul. 9, 2015)
Today we review a guide about urban air pollution that looks into the role that street trees play with respect to reducing air pollution. The overall conclusion was that trees are unlikely to reduce air pollution and could add to it, especially if the trees reduce ventilation of air currents. This is true also of the more recent use of green walls. It is also acknowledged [in a Toronto study]that urban trees can improve health – as much as a $10,000 raise or feeling 7 years younger. Pine trees are singled out as a particular contributer to urban pollution through their emissions of volatile organic compounds (VOC) which combine with the NO2 in car emissions to produce low level ozone, one of a handful of pollutants harmful to health.
To see Key Quotes and Links to key reports about this post, click HERE
Filed under: Health Impacts, Standards/Regulations | Tagged: health, standards | Leave a comment »
Posted on January 17, 2017 by pollutionfree
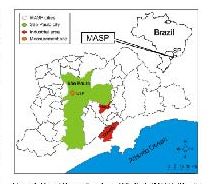
Effect of vehicular traffic, remote sources and new particle formation on the activation properties of cloud condensation nuclei in the megacity of São Paulo, Brazil (22 page pdf, Carlos Eduardo Souto-Oliveira, Maria de Fátima Andrade, Prashant Kumar, Fábio Juliano da Silva Lopes, Marly Babinski, and Eduardo Landulfo, Atmos. Chem. Phys., Nov. 24, 2016)
Today we review research on the impact vehicle emissions have on cloud formation in the largest city in South America with a 20M population and 7 M vehicles. Such a concentration of emissions may have global impacts on precipitation. Cloud condensation nuclei in this city originate from three sources: vehicle emissions, biomass burning in the vast tropical forests and from sea-salt. Careful direct and indirect (lidart) measurements over a four month period revealed that vehicles were predominant in producing these nuclei with two diurnal maxima during rush hours.
To see Key Quotes and Links to key reports about this post, click HERE
Filed under: Urban Traffic | Tagged: emissions, traffic | Leave a comment »
Posted on January 12, 2017 by pollutionfree
The Rationale for Accelerating Regionally Focused Climate Intervention Research (17 page pdf, Michael C. MacCracken, Earth’s Future, Nov. 14, 2016)
Today we review a proposal to focus on particular regions where effort to reduce climate impacts would be more effective and likely have fewer unintended negative consequences than efforts aimed at the globe as a whole. Included in the potential approaches are modifying arctic warming by injecting sulfate aerosols directly into the Arctic atmosphere, moderate the intensity of tropical cyclones by brightening cloud albedoes, slowing the melting of Greenland and Antarctic ice sheets by blocking ice streams, and compensate for the reduced cooling from SO2 emissions in Asia by brightening the Pacific Ocean.

Two people on the shore of the Pacific Ocean (Photo credit: Wikipedia)
To see Key Quotes and Links to key reports about this post, click HERE
Filed under: Environmental Plans | Tagged: climate, emissions, plan | Leave a comment »
Posted on January 10, 2017 by pollutionfree
Effects of an air pollution personal alert system on health service usage in a high-risk general population: a quasi-experimental study using linked data (7 page pdf, R A Lyons, S E Rodgers, S Thomas, R Bailey, H Brunt, D Thayer, J Bidmead, B A Evans, P Harold, M Hooper, H Snooks, J Epidemiol Community Health, May 23, 2016)
Today we review an analysis of the reaction of an “intervention” group of patients with air pollution- related illnesses (cardio-respiratory and COPD) to alerts produced by the UK’s airAware alert system over a two year period, as measured by visits to hospital emergency departments, compared to a control group which were not similarly afflicted. Results indicate a doubling of emergency admissions and four times the number of respiratory conditions for the intervention group compared to the control group. The authors conclude that some health interventions or alerts beyond a certain distribution level are harmful in terms of health service utilisation.

To see Key Quotes and Links to key reports about this post, click HERE
Filed under: Outreach/education, Standards/Regulations | Tagged: health, pollution, standards | Leave a comment »
Posted on January 5, 2017 by pollutionfree
Long-term exposure to air pollution is associated with biological aging (16 page pdf, Cavin K. Ward-Caviness, Jamaji C. Nwanaji-Enwerem, Kathrin Wolf, Simone Wahl, Elena Colicino, Letizia Trevisi, Itai Kloog, Allan C. Just, Pantel Vokonas, Josef Cyrys, Christian Gieger, Joel Schwartz, Andrea A. Baccarelli, Alexandra Schneider and Annette Peters, Oncotarget, Oct. 25, 2016)
Also discussed here: Telomere (Wikipedia)
Today we review research conducted with older men and women (median age 74) where several measures of aging and old age illnesses, such as cardiovascular disease, cancer and cognitive abilities, were studied including chromosome characteristics (telomere length) and immune cell counts. Results indicate that air pollution exposure over a long time can damage the DNA, alter immune cell counts and add to oxidative stress with greater impact on men than women.

Telomere (Photo credit: Wikipedia)
To see Key Quotes and Links to key reports about this post, click HERE
Filed under: Health Impacts | Tagged: health, traffic | Leave a comment »
Posted on January 3, 2017 by pollutionfree
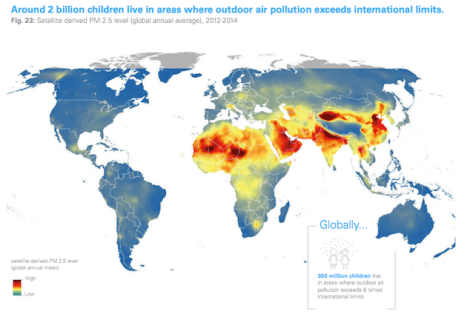
Clear the air for children – The impact of air pollution on children (100 page pdf, Editor-In-Chief, David Anthony, UNICEF, Oct. 2016)
Also discussed here: A Staggering Number of the World’s Children Are Breathing Toxic Air (Mother Jones, Oct. 31, 2016)
Today we review a report that documents the impact of indoor and outdoor pollution on the children of the world who are particularly vulnerable because, for their size, they breathe more air than adults into lungs that are only beginning to develop. 300 million children live in areas with toxic air pollution and 2 billion live in areas where the air pollution exceeds minimum quality standards as set by the World Health Organization. Steps are recommended (that apply to highly developed countries and cities as well as developing countries) to reduce this toll including less pollution indoors by using ventilation, better insulation to reduce fuel burning and cleaner stoves. Outdoors, situate schools and day cares away from traffic related pollution, replace private vehicle transportation with public transit, walking and cycling and monitor air pollution more carefully especially as it impacts child health.
To see Key Quotes and Links to key reports about this post,. click HERE
Filed under: Uncategorized | Tagged: health, pollution, transportation, waste disposal | Leave a comment »
Posted on December 29, 2016 by pollutionfree
Resilience of Infrastructure Systems to Sea-Level Rise in Coastal Areas: Impacts, Adaptation Measures, and Implementation Challenges (28 page pdf, Beatriz Azevedo de Almeida and Ali Mostafavi, Sustainability, Nov. 1, 2016)
Today we summarize a literature review of research papers examining the impacts of sea level rise on coastal areas of the world which include flooding, coastal erosion, land subsidence and saltwater intrusion. A rise of only ½ a meter in the next 50 years puts at risk 150 million people and $35 trillion of assets in 20 of the world’s most vulnerable port cities. Any success in reducing carbon emissions and the associated increase via climate change in temperature, precipitation and sea level rise would allow for 30% less impact on infrastructure systems such as power stations, oil and gas refineries and wastewater treatment plants.

To see Key Quotes and Links to key reports about this post, click HERE
Filed under: Uncategorized | Tagged: climate, infrastructure, waste disposal | Leave a comment »
Posted on December 27, 2016 by pollutionfree
Long-term exposure to ambient air pollution and traffic noise and incident hypertension in seven cohorts of the European study of cohorts for air pollution effects (ESCAPE) (Abstract, Kateryna B Fuks, Gudrun Weinmayr, Xavier Basagaña, Olena Gruzieva, Regina Hampel, Bente Oftedal, Mette Sørensen, Kathrin Wolf, Geir Aamodt, Gunn Marit Aasvang, Inmaculada Aguilera, Thomas Becker, Rob Beelen, Bert Brunekreef, Barbara Caracciolo, Josef Cyrys, Roberto Elosua, Kirsten Thorup Eriksen, Maria Foraster, Laura Fratiglioni, Agneta Hilding, Danny Houthuijs, Michal Korek, Nino Künzli, Jaume Marrugat, Mark Nieuwenhuijsen, Claes-Göran Östenson, Johanna Penell, Göran Pershagen, Ole Raaschou-Nielsen, Wim Swart Jr, Annette Peters, Barbara Hoffmann, European Heart Journal, Oct. 24, 2016)
Also discussed here: World’s largest study shows effects of long-term exposure to air pollution and traffic noise on blood pressure (ScienceDaily, Oct. 25, 2016)
Today we review research based on the effects of traffic –related air pollution and noise in five countries for 5-9 years. Results indicate that the risk of high blood pressure or hypertension increased by 20% for those who live in more polluted areas (for every increase of 5 µg/m3 of PM2.5) and by 6% for those living in areas with a higher level of noise. Air pollution was higher in Germany and Spain than in Scandinavian countries and the combination of air and noise pollution was higher in Spain and Sweden.

English: Main complications of persistent high blood pressure. Sources are found in main article: Wikipedia:Hypertension#Complications. To discuss image, please see Template_talk:Häggström diagrams. To edit, please use the svg version, convert to png and update both versions online. (Photo credit: Wikipedia)
To see Key Quotes and Links to key reports about this post, click HERE
Filed under: Uncategorized | Tagged: health, noise, pollution, roads | Leave a comment »
Posted on December 22, 2016 by pollutionfree
The Effect of Air Pollution on Investor Behavior: Evidence from the S&P 500 (Abstract, Anthony Heyes, Matthew Neidell, Soodeh Saberian, National Bureau of Economic Research, Oct. 26, 2016)
Also discussed here: Why investors may want to keep tabs on air pollution (CBS News, Oct. 26, 2016)
And here: Air pollution and stock returns: Evidence from a natural experiment (Abstract, Gabriele M. Lepori, Journal of Empirical Finance, Jan. 2016)
And here: Does the weather have impacts on returns and trading activities in order-driven stock markets? Evidence from China (Jing Lu, Robin K. Chou, Journal of Empirical Finance, Jan. 2012)
And here: Air pollution and stock returns in the US (Abstract, Tamir Levy, Joseph Yagil, Journal of Economic Psychology, Jun. 2011)
Today we review several reports that look at the links, if any, between investment returns and short term changes in local air quality, as examined in the stock exchanges of the USA, Italy and China. There is some evidence that higher levels of fine particulate matter may reduce one day returns by almost 12%. Also, when the trading floor is near or within an area of higher air pollution, trading activity is affected.

The main trading room of the Tokyo Stock Exchange,where trading is currently completed through computers. (Photo credit: Wikipedia)
To see Key Quotes about this post, click HERE
Filed under: Uncategorized | Tagged: economic, pollution | Leave a comment »
Posted on December 20, 2016 by pollutionfree
50 Steps Toward Carbon-Free Transportation – Rethinking U.S. Transportation Policy to Fight Global Warming (92 page pdf, Farontier Group, Oct. 24, 2016)
Also discussed here: Report: Global Warming Solutions (Environment America Research & Policy Center, Oct. 24, 2016)
Today we review a report that recommends 50 steps aimed at state and federal program and policies that could make the USA’s transportation system carbon free by 2050. The steps include making carbon reduction strategies a key priority by exploiting the growth of electric vehicles, autonomous vehicles and the sharing of cars and bicycles, adding more effective public transit, employing smart pricing policies and phasing out carbon intensive vehicles and fuels.

To see Key Quotes and Links to key reports about this post, click HERE
Filed under: Uncategorized | Tagged: climate, emissions, future, standards, transportation | Leave a comment »
Posted on December 15, 2016 by pollutionfree
Resilience of Infrastructure Systems to Sea-Level Rise in Coastal Areas: Impacts, Adaptation Measures, and Implementation Challenges (28 page pdf, Beatriz Azevedo de Almeida and Ali Mostafavi, Sustainability, Nov. 1, 2016)
Today we summarize a literature review of research papers examining the impacts of sea level rise on coastal areas of the world which include flooding, coastal erosion, land subsidence and saltwater intrusion. A rise of only ½ a meter in the next 50 years puts at risk 150 million people and $35 trillion of assets in 20 of the world’s most vulnerable port cities. Any success in reducing carbon emissions and the associated increase via climate change in temperature, precipitation and sea level rise would allow for 30% less impact on infrastructure systems such as power stations, oil and gas refineries and wastewater treatment plants.

To see Key Quotes and Links to key reports about this post, click HERE
Filed under: Uncategorized | Tagged: climate, future, infrastructure | Leave a comment »
Posted on December 13, 2016 by pollutionfree
Long-term exposure to ambient air pollution and traffic noise and incident hypertension in seven cohorts of the European study of cohorts for air pollution effects (ESCAPE) (Abstract, Kateryna B Fuks, Gudrun Weinmayr, Xavier Basagaña, Olena Gruzieva, Regina Hampel, Bente Oftedal, Mette Sørensen, Kathrin Wolf, Geir Aamodt, Gunn Marit Aasvang, Inmaculada Aguilera, Thomas Becker, Rob Beelen, Bert Brunekreef, Barbara Caracciolo, Josef Cyrys, Roberto Elosua, Kirsten Thorup Eriksen, Maria Foraster, Laura Fratiglioni, Agneta Hilding, Danny Houthuijs, Michal Korek, Nino Künzli, Jaume Marrugat, Mark Nieuwenhuijsen, Claes-Göran Östenson, Johanna Penell, Göran Pershagen, Ole Raaschou-Nielsen, Wim Swart Jr, Annette Peters, Barbara Hoffmann, European Heart Journal, Oct. 24, 2016)
Also discussed here: World’s largest study shows effects of long-term exposure to air pollution and traffic noise on blood pressure (ScienceDaily, Oct. 25, 2016)
Today we review research based on the effects of traffic –related air pollution and noise in five countries for 5-9 years. Results indicate that the risk of high blood pressure or hypertension increased by 20% for those who live in more polluted areas (for every increase of 5 µg/m3 of PM2.5) and by 6% for those living in areas with a higher level of noise. Air pollution was higher in Germany and Spain than in Scandinavian countries and the combination of air and noise pollution was higher in Spain and Sweden.

Car owners request measures against traffic noise for the road at their home, a typical Nimby (Not In My Backyard) situation (Photo credit: Wikipedia)
To see Key Quotes and Links to key reports about this post, click HERE
Filed under: Uncategorized | Tagged: health, noise, roads, traffic | Leave a comment »
Posted on December 8, 2016 by pollutionfree
50 Steps Toward Carbon-Free Transportation – Rethinking U.S. Transportation Policy to Fight Global Warming (92 page pdf, Farontier Group, Oct. 24, 2016)
Also discussed here: Report: Global Warming Solutions (Environment America Research & Policy Center, Oct. 24, 2016)
Today we review a report that recommends 50 steps aimed at state and federal program and policies that could make the USA’s transportation system carbon free by 2050. The steps include making carbon reduction strategies a key priority by exploiting the growth of electric vehicles, autonomous vehicles and the sharing of cars and bicycles, adding more effective public transit, employing smart pricing policies and phasing out carbon intensive vehicles and fuels.
To see Key Quotes and Links to key reports about this post, click HERE
Filed under: Environmental Plans, Urban Traffic | Tagged: climate, emissions, future, transportation | Leave a comment »
Posted on December 6, 2016 by pollutionfree
Adapting to rates versus amounts of climate change: a case of adaptation to sea-level rise ( 9 page pdf, Soheil Shayegh, Juan Moreno-Cruz and Ken Caldeira, Environmental Research Letters, Oct. 4, 2016)
Today we review the most immediate aspect of climate change- its impact in terms of sea level rise and how best to adapt to this financially, given that many coastal cities are threatened including London, New York, and Tokyo. The authors consider four scenarios given the current rate of rise of 44 cm/100 years which is expected to increase by almost a factor of ten to 344 cm/100 years as Antarctic ice continues to melt over the next 1,000 years for a 60 m rise in sea level. The scenarios include: taking no action, creating a buffer zone, adapting to change in rise and building dikes to withstand increased sea levels. The optimum distance from the sea for safety increases from 310 m to 481 m as the rate of rise of sea level doubles. Insurance based on static risk need to be revised to a more flexible approach based on rate of rise.

To see Key Quotes and Links to key reports abut this post, click HERE
Filed under: Environmental Plans | Tagged: climate, economic, future, roads | Leave a comment »
Posted on December 1, 2016 by pollutionfree
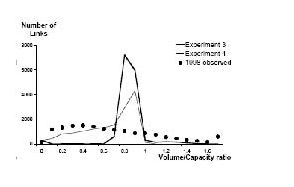
A Model of the Rise and Fall of Roads (33 page pdf, Zhang, Lei, Levinson, David M, Systems Symposium at the Massachusetts Institute of Technology, Mar. 2004)
Today we review a seminal paper from over a decade ago that examines the dynamics of road development in a major mid-West American city (Minneapolis-Saint Paul) using a model that combines measures such as travel demand statistics (usually found on Origin Destination studies) with the economics of road pricing or tolls, geographical constraints (such as rivers and mountains) and how these change with newer technology over time (in this case over 20 years). Roads represent both figuratively and physically the link that join the issues addressed in this blog: how traffic is linked to pollution and how pollution is linked to health. Of particular interest is the way that travel demand and road volume capacity (VC) interact with road tolls and the cost of road construction and the resulting revenue that may be used to ease congestion, in addition to the overall design of the road network and design for a major urban area.
To see Key Quotes and Links to key reports about this post, click HERE
Filed under: PRICING, Urban Traffic | Tagged: economic, roads | Leave a comment »
Posted on November 29, 2016 by pollutionfree
Air pollution: Tyre and brake fatigue compound an exhausting problem (OECD, Shayne MacLachlan, OECD Environment Directorate, Sep.8, 2016)
Today we review research into the impact of particles generated from tires and brake wear. The amount of particulate matter for an average urban arterial road with 25K vehicles per day can produce up to 9 kg of dust per km- bigger roads or highways with 100K VPD can produce four times that. Recycled tires from the billion cars in the road globally into materials used in playgrounds is being called the new asbestos. Banning petrol powered cars from cities to encourage e-cars and cycling means less emissions from the tailpipe and good for carbon emission reduction but it also means the same wear and particles from brakes and tires, in terms of air pollution and health, even from bicycles!

Studded tyre Español: Neumático de invierno con clavos, modelo Nokian Hakkapeliitta 4 (Photo credit: Wikipedia)
To see Key Quotes and Links to key reports about this post, click HERE
Filed under: Health Impacts, Urban Traffic | Tagged: health, pollution, traffic | Leave a comment »
Posted on November 24, 2016 by pollutionfree
Mitigation of methane emissions in cities: how new measurements and partnerships can contribute to emissions reduction strategies (39 page pdf, Francesca M. Hopkins, James R. Ehleringer, Susan E. Bush, Riley M. Duren, Charles E.Miller, Chun-Ta Lai, Ying-Kuang Hsu, Valerie Carranza, James T. Randerson, Earth’s Future, Sep. 10, 2016)
Today we review research into methane emissions from cities which along with other greenhouse gases contributes to climate warming. Cities themselves account for 70% of GHG emissions globally. Unlike CO2 however, methane emissions are more easily managed at the city level whether they come from transportation and the increased shift to natural gas as a fuel for city vehicles or, secondarily, from landfills where methane is emitted from decomposing organic materials or, thirdly, from leaks in the systems delivering natural gas to users. One of the major problems is the lack of accurate inventories of methane emissions which in some cities results in an underestimate of 50%. Some efforts being made in the transportation sector to reduce CO2 emissions include shifts to the use of propane or natural gas but these may have unintended consequences in terms of their contribution as a radiatively active gas to the greenhouse effect. Landfill emissions may be reduced by simply reducing the amount of waste generated though pricing of garbage or encouraging home composting.

To see Key Quotes and Links to key reports about this post, click HERE
Filed under: Environmental Plans, Standards/Regulations | Tagged: climate, emissions, waste disposal | Leave a comment »
Posted on November 22, 2016 by pollutionfree
Urban futures: anticipating a world of cities (6 page pdf, Geci Karuri-Sebina, Karel-Herman Haegeman and Apiwat Ratanawaraha, Foresight, Sep. 10, 2016)
Today we review an introduction to a series of papers on cities from a foresight point of view. It begins with a prediction that the city has evolved from the city-state in Ancient Greece to city-worlds in the next 100 years. By 2050, 70% of the world’s population will live in urban areas, compared to 54% today. While cities can improve economic prosperity, reducing poverty and becoming more inclusive socially, there are also downside risks of unemployment and poverty, as well as tensions based on religion, race and values – in addition to the major health threats that resulting congestion and emissions from downtown traffic where city government has not taken steps to alleviate. While cities are good at generating problems they also have a problem solving capability. The paper ends on an optimistic note: “In a world that increasingly appears ungovernable, cities – not states – are the islands of governance on which the future world order will be built”- something that those who try to come to grips with climate change and urban air pollution need to acknowledge and take count of in reducing carbon emissions and adapting to the challenge.

Indoor and Built Environment (Photo credit: Wikipedia)
To see Key Quotes and Links to key reports about this post, click HERE
Filed under: Environmental Plans, Health Impacts, Standards/Regulations, Urban Traffic | Tagged: climate, future, health, standards, traffic, transportation | Leave a comment »
Posted on November 17, 2016 by pollutionfree
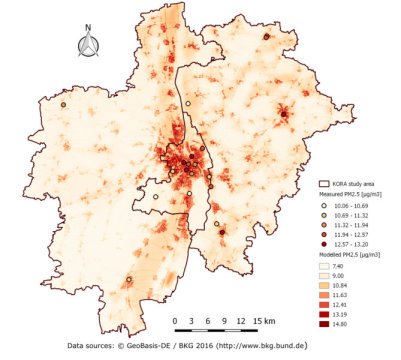
Association Between Long-Term Exposure to Air Pollution and Biomarkers Related to Insulin Resistance, Subclinical Inflammation and Adipokines (Abstract, Kathrin Wolf, Anita Popp, Alexandra Schneider, Susanne Breitner, Regina Hampel, Wolfgang Rathmann, Christian Herder, Michael Roden, Wolfgang Koenig, Christa Meisinger, Annette Peters, KORA-Study Group, Diabetes, Aug. 8, 2016)
Also discussed here: Air pollution a risk factor for diabetes, say researchers (ScienceDaily, Sep.8, 2016)
And here: Diabetes Research – Risk Factor Air Pollution (Press Release, Helmholtz Zentrum München, Sep. 8, 2016)
And here: Air pollution exposure found to be risk factor for type 2 diabetes (Green Car Congress, Sep. 8, 2016)
Today we review research from Germany which examined the level of air pollution at the places of residence of 3,000 participants and how this relates to blood marker levels such as impaled glucose metabolism and the risk of Type 2 diabetes. Results indicate that a 7.9μg/m3 increment in particulate matter <10μm was associated with insulin resistance and that NO2, in particular, had a highly significant effects with pre-diabetic individuals as opposed to those who were either diabetic or not.
To see Key Quotes and Links to key reports about this post, click HERE
Filed under: Health Impacts | Tagged: health, pollution | Leave a comment »
Posted on November 15, 2016 by pollutionfree
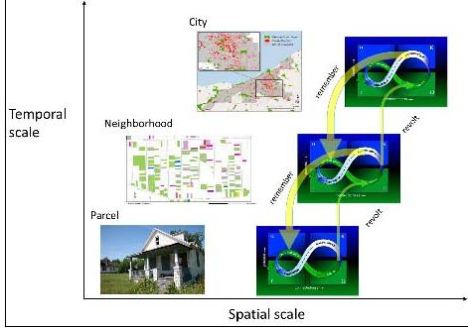
Sustainability for Shrinking Cities (9 page pdf, Dustin L. Herrmann, William D. Shuster, Audrey L. Mayer and Ahjond S. Garmestani, Sustainability, Editorial, Sep. 7, 2016)
Today we review an overview (and editorial) focused on sustainability for cities in the face of increasing urbanization worldwide and to the recent trend toward shrinking cities because of economic depression and the hollowing out of city centres as a result. Many large growing, economically-healthy cities tend to replace urban greenspace and urban parkland with high income residential or commercial developments with significant negative impacts on a healthy environment. Shrinking economically poor cities on the other hand are faced with vacant downtown lots some of which steer toward sustainable cities through improved water filtration, dampening of urban flash floods and carbon sequestration. For many coastal cities, sea level rise and threats to human health from more frequent hot spells as a result of climate warming are other issues on cities to adapt sustainably with more thoughtful urban planning.
To see Key Quotes and Links to key reports about this post, click HERE
Filed under: Environmental Plans, Standards/Regulations | Tagged: climate, plan, standards, transportation | Leave a comment »
Posted on November 10, 2016 by pollutionfree
The Paris Agreement and the New Logic of International Climate Politics (28 page pdf, Robert Falkner, International Affairs, Aug.31, 2016)
Today we review an analysis of the international negotiations from the top-down 1996 Kyoto Accord that today applies only to 15% of global carbon emissions, to the 2009 Copenhagen Accord that failed to reach consensus on a global emission reduction goal but managed to provide an umbrella for all participating countries for future negotiations. To the bottom-up Paris Agreement in 2015, signed by 195 nations, combines domestic politics with international commitments through a “naming and shaming” approach, voluntary national commitments, rachet-up reviews every five years and, perhaps most importantly, definition of a long term goal to reach “net-zero” emissions or “emission neutrality” between 2050 and 2100. As these voluntary commitments would result in a global warming of 2.7 C above pre-industrial levels, further reductions beyond the pledges are needed. The author cautions that “the Paris Agreement cannot be expected to ‘fix’ the climate problem; it can only provide a supportive framework within which states and other actors can achieve the required emissions cuts.”

Carbon emissions from various global regions during the period 1800–2000 AD (Photo credit: Wikipedia)
To see Key Quotes and Links to key reports about this post, click HERE
Filed under: Environmental Plans, Standards/Regulations | Tagged: climate, emissions, future, plan, standards | Leave a comment »
Posted on November 8, 2016 by pollutionfree
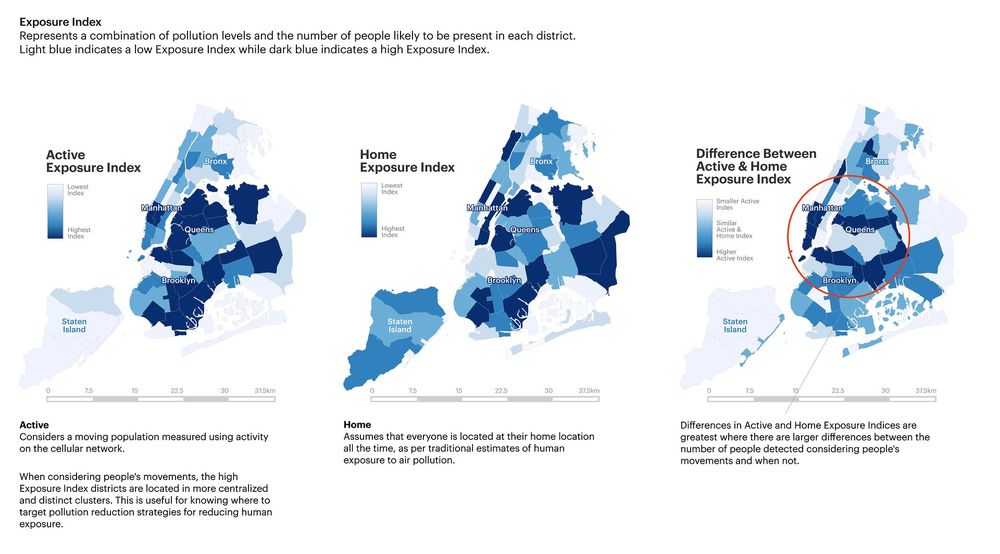
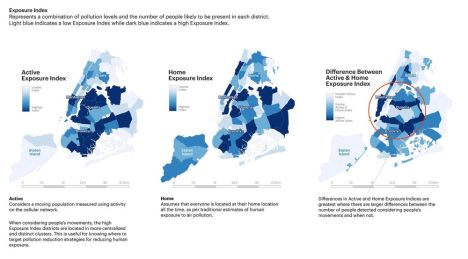
The Impact of Mobile-Device-Based Mobility Patterns on Quantifying Population Exposure to Air Pollution (11 page pdf, Marguerite Nyhan, Sebastian Grauwin, Rex Britter, Bruce Misstear, Aonghus McNabola, Francine Laden, Steven R. H. Barrett, and Carlo Ratti, Environmental Science and Trechnology, Aug. 12, 2016)
Also discussed here: Air pollution threat hidden as research ‘presumes people are at home’: study (The Guardian, Aug. 24, 2016)
And here: Urban air pollution is worse than we think—but better data might solve the problem (Barbara Eldredge, CURBED, Aug. 30, 2016)
Today we review research into a study in New York City that compared the exposure to urban air pollution during an active day at the place of work and travelling to that rather than as earlier exposure studies have done only at the place of residence. The results indicate, first of all, that the highest concentration of PM2.5 is not surprisingly in central Brooklyn and Queens and in the southern half of Manhattan Island. Pollution levels at places of work compared to those at residences was 10 μg/m3 higher which suggests that a higher congestion charge be applied to vehicles which enter the high emission zones (which is the basis for the [present congestion charge zone in London, UK) .Future applications of this research when self driving cars are the norm might involve automatically controlling their movement to avoid adding to the pollution levels in some packets of the city.
To see Key Quotes and Links to key reports about this post, click HERE
Filed under: Health Impacts, Monitoring Networks, Standards/Regulations | Tagged: emissions, health, monitors, standards | Leave a comment »
Posted on November 3, 2016 by pollutionfree
High-resolution analytical imaging and electron holography of magnetite particles in amyloid cores of Alzheimer’s disease (12 page pdf, Germán Plascencia-Villa, Arturo Ponce, Joanna F. Collingwood, M. Josefina Arellano-Jiménez, Xiongwei Zhu, Jack T. Rogers, Israel Betancourt, Miguel José-Yacamán & George Perry, Nature Scientific Reports, Apr. 28, 2016)
Also discussed here: Toxic air pollution particles found in human brains (Guardian, Sep. 5, 2016)
And here: ‘Air pollution’ particles linked to Alzheimer’s found in human brain (Sarah Knapton, The Telegraph, Sep. 5, 2016)
Today we review research that has found tiny iron oxide [magnetite] particulates, produced by diesel engines as well as from brake wear in cars and trains, can enter the human brain where they pose a risk of diseases such as Alzheimer’s which affects more than 5 million people over 65 in the USA alone.Researchers found magnetite in the brains of 37 people in their study areas of Manchester and Mexico.

To see Key Quotes and Links to key reports about this post, click HERE
Filed under: Health Impacts | Tagged: health, pollution | Leave a comment »
Posted on November 1, 2016 by pollutionfree
Cognitive function and short-term exposure to residential air temperature: A repeated measures study based on spatiotemporal estimates of temperature (Abstract, Lingzhen Dai, Itai Kloog, Brent A. Coull, David Sparrow, Avron Spiro III, Pantel S. Vokonas, Joel D. Schwartz, Environmental Research, Jul. 5, 2016)
Today we review research into the cognitive abilities of a sample of older men (average age 74) in the northeast USA to exposure to indoor temperatures of up to 25.7 C for short periods of time. This is important for at least two reasons: over the next 20 years, climate change will lead to a doubling of the number of days above 30C and, in addition, the number of people over 70 is also expected to double over the next 20 years. Earlier studies indicate that exposure to outdoor temperatures above 32C (and below -10C) led to the greatest drop in cognitive abilities. Heat stress may lead to poor decision making that adds to the health risk that these people face during heat waves. Results indicate that higher temperatures affect hippocampal neural activities that are crucial for brain functions like learning and memory. Both hot and cold temperatures are associated with a loss of cognitive abilities and this may be greater for persons over the age of 70. Further research along these lines is needed to examine the impact on older women.

To see Key Quotes and Links to key reports about this post, click HERE
Filed under: Health Impacts | Tagged: climate, health | Leave a comment »
Posted on October 27, 2016 by pollutionfree

Nederlands: Cartoon about climate change (Photo credit: Wikipedia)
Assessing climate change vulnerability in urban America: stakeholder-driven approaches (Abstract, Sabrina McCormick, Climatic Change, Aug. 31, 2016)
Also discussed here: Study assesses climate change vulnerability in urban America: Most city planners have yet to prepare for climate-related risks and the consequences. (ScienceDaily, Aug. 31, 2016)
And here: Politicization of climate change hinders adaptation in cities — report (Brittany Patterson, E&E reporter, ClimateWire, Nov. 18, 2015
Today we review an assessment of how well 6 cities in the USA (Portland; Boston; Los Angeles; Tucson, Ariz.; Raleigh, N.C.; and Tampa, Fla.)are addressing their vulnerability to climate change. The order of preparedness is the in the same order as given with Portland at the forefront and Tampa bringing up the rear. The biggest obstacle was the lack of acknowledgment of climate change as an issue- something seen as well in Canada, in such cities as its capital city, Ottawa. The overlooked vulnerabilities includes hardening infrastructure against the increased frequency and intensity of such hazards as flooding and electrical storms and safeguarding some parts of the population, particularly older people, to such health hazards as smog events and heat waves.
To see Key Quotes and Links to key reports about this post, click HERE
Filed under: Uncategorized | Tagged: climate, future, health, transportation | Leave a comment »
Posted on October 25, 2016 by pollutionfree
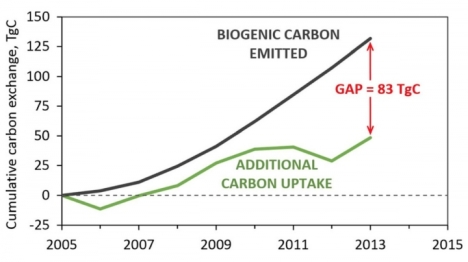
Carbon balance effects of U.S. biofuel production and use (John M. DeCicco, Danielle Yuqiao Liu, Joonghyeok Heo, Rashmi Krishnan, Angelika Kurthen, Louise Wang, Climatic Change, Aug. 25, 2016)
Also discussed here: Biofuels increase, rather than decrease, heat-trapping carbon dioxide emissions (ScienceDaily, Aug.25, 2016)
And here: Controversial study claims biofuels aren’t carbon neutral, says it’s much worse than gasoline (ZNE Science, Aug. 26, 2016)
Today we review research into the belief assumed by government policy to justify agricultural subsidies that biofuels (mostly from corn and soy beans) which currently amounts to 14.6 B gallons/year (or 6% of emissions) offset carbon emissions using petroleum products. This belief is based on the supposition that emissions from biofuels balance carbon emissions by absorbing CO2 from the atmosphere during photosynthesis from the new crops. Results indicate that this additional carbon uptake is only 37% of the emissions from biofuels. The conclusion reached is that the rising use of biofuels (which has tripled over the last 10 years) has resulted in net increase rather than a net decrease in carbon emissions.
To see Key Quotes and Links to key reports about this post, click HERE
Filed under: Environmental Plans, Standards/Regulations | Tagged: climate, emissions | Leave a comment »
Posted on October 20, 2016 by pollutionfree
What low carbon futures might look like… (Ralph Torrie, Aug. 27, 2016)
Also discussed here: Low Carbon Energy Futures: A Review of National Scenarios (55 page pdf, Ralph D. Torrie, Tyler Bryant, Dale Marshall, Mitchell Beer, Blake Anderson, Ryan Kadowaki, and Johanne Whitmore, Technical Report, Trottier Energy Futures Project, Jan. 2013)
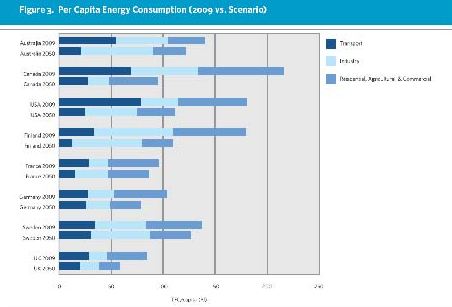
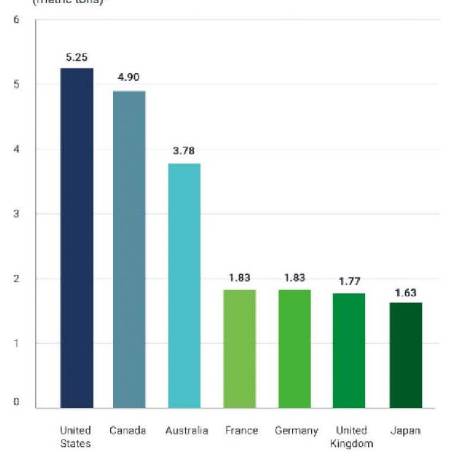
Today we review a report that compares low carbon future scenarios from 8 countries: 3 carbon resource rich (USA, Canada, Australia) and 5 European countries (Sweden Germany, France, Finland, UK). The common goal of the scenario was to lower carbon emissions by 80% from 1990 levels. Each country has its own approaches to the challenge from differing start points and so the scenarios differ as well although some similarities were noted including: decarbnization of the electricity supply, increased efficiency of fuels, a large supply of biofuels and electricity‘s share of the total energy consumption grows over time. Sweden has by far the lowest energy intensity because almost all of its electricity comes from nuclear, hydro and biomass- so that future reductions in carbon emissions comes from increased energy efficiency. Canada like Sweden also generates energy from non-carbon sources but has larger inputs ofnon-renewable energy sources (natural gas, coal, oil) in its energy pie and so has further to go to reach 80% less carbon emissions. Over 50% reductions in carbon emissions in Canada and the USA is in transportation where the growth of electric vehicles is key.

To see Key Quotes and Links to key reports about this post, click HERE
Filed under: Environmental Plans, Standards/Regulations | Tagged: climate, emissions, future, plan, transportation | Leave a comment »
Posted on October 18, 2016 by pollutionfree
A Better Life with a Healthy Planet – Pathways to Net-Zero Emissions, A New Lens Scenarios Supplement (96 page pdf, Shell, May 2016)
Today we review a supplement to the Shell scenarios published in 2013 that examined steps toward a net zero energy future. The Shell scenario team became famous for their contributions to determining post-apartheid options for South Africa after 1990. It is a scoping document, starting with an estimate of the energy needs of the world in 2100 “for a better life”, based on a 50% population increase and a lowering of energy demand per person from as much as 300 gigajoules in USA/Canada to 100 GJ per person, as a world average – which amounts to a doubling of the global energy needs.
To accomplish this by 2050 and meet the Paris goal of limiting warming to 1.5 C, would require net zero emissions by that year and that, in turn, would require some form of negative carbon reduction, using technologies such as Carbon Capture and Storage (CCS) which would mean lowering its current high cost to around $30 per tonne by 2030- equivalent to wind power costs. Carbon pricing is seen as an absolute necessity to bring solar energy up to 40% of energy needs by 2060. It also requires 80% of passenger cars converted to electricity by 2030 and, in terms of land use, reducing drastically the amount of agricultural land used for feeding animals from the current 80%. For developing countries, investment in infrastructure and adapting to a solar society would allow them to leap-frog to net zero emissions as well.

To see Key Quotes and Links to key reports about this post, click HERE
Filed under: Environmental Plans | Tagged: climate, emissions, future, pricing | Leave a comment »
Posted on October 13, 2016 by pollutionfree
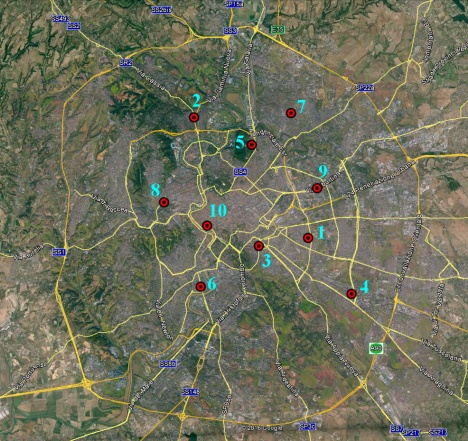
Assessment of the Air Pollution Level in the City of Rome (Italy) (15 page pdf, Gabriele Battista, Tiziano Pagliaroli, Luca Mauri, Carmine Basilicata and Roberto De Lieto Vollaro, Sustainability, Aug. 23, 2016)
Today we review an assessment of urban pollution in Italy’s largest city, Rome, whose population in the metropolitan area reaches 4.3 million. Emissions from private vehicles, used by 60% of the population, are the main source of pollution, particularly in winter, with peaks twice daily at rush hour, like many other large cities in the developed world. PM2.5 is one of a small number of pollutants with major health impacts as well as damage to monuments and historical buildings n the urban area which are many in this city with a long history. Reduction or elimination of the post polluting vehicles (Euro class 0,1 and 2) is seen as the most effective way to reduce pollution levels.
To see Key Quotes and Links to key reports about this post, click HERE
Filed under: Health Impacts, Monitoring Networks | Tagged: health, monitors, traffic | Leave a comment »
Posted on October 11, 2016 by pollutionfree
The last Summer Olympics? Climate change, health, and work outdoors (Kirk. R. Smith, The Lancet, Aug. 13, 2016)
Also discussed here: When Will It Get Too Hot to Hold the Summer Olympics? (Linda Poon, MSN, Aug. 15, 2016)
And here: By 2085, most cities could be too hot for the Summer Olympics (Chris Mooney, Washington Post, Aug. 16, 2016)
And here: Are the Winter Olympics at Risk because of Global Climate Warming? (Pollution Free Cities, Mar.5, 2014)
Today we review a new report about the feasibility of holding the summer Olympic games when the temperatures and humidity get to levels unsafe for vigorous activities. Just as lack of cold and snow will make the choice of sites for Winter Olympics difficult, so it is with high levels of heat and moisture in the air with the Summer Olympics The authors predict that with the course climate warming is on now that, in 50-60 years (2085), there will only be 8 cities out of 543 cities outside western Europe that would be “low risk” or acceptable. This same threat applies more generally to anyone attempting to work or exercise physically outdoors during the summer heat.

To see Key Quotes and Links to key reports about this post, click HERE
Filed under: Environmental Plans, Health Impacts | Tagged: climate, health, standards | Leave a comment »
Posted on October 6, 2016 by pollutionfree
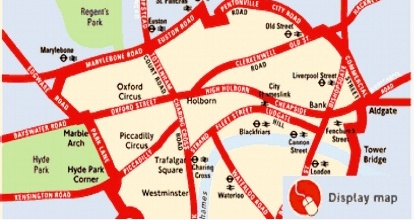
London Congestion Pricing – Implications for Other Cities (5 page pdf, Todd Litman, CESifo DICE Report 3/2005, Mar. 2005)
Today we review a paper that assessed the performance of the London Congestion Charge after it had operated for 2 years. The winners include bus and taxi users, pedestrians and cyclists and motorists with high value trips and most city centre businesses with congestion delays reduced reduced by 50% and net annual revenue of 97 million UK pounds to support transit/pedestrian and cycling infrastructure. Losers include motorists with marginal value trips and riders and motorists in border areas who a 10% increase in spillover traffic (but no more delay because of proactive action to adjust traffic signals). The London congestion charging system was a first for Europe and probably stimulated similar initiatives in Stockholm, Sweden Trondheim, Norway and Singapore in Asia.
To see Key Quotes and Links to key reports about this post, click HERE
Filed under: PRICING | Tagged: congestion, economic, pricing, traffic, transportation | Leave a comment »
Posted on October 4, 2016 by pollutionfree
Implications of the Paris Agreement for Carbon Dioxide Removal and Solar Geoengineering (10 page pdf, Joshua B. Horton, David W. Keith, and Matthias Honegger, Harvard Project on Climate Agreements, Jul. 2016)
The Paris Agreement did not explicitly mention geoengineering as a solution, in addition to efforts to reduce carbon emissions, to the challenges involved in reaching the ultimate goal of end to global warming and a stable radiation equilibrium,. Geoengineering may be broken down into two approaches: carbon dioxide removal (CDR) (as shown, for example, by carbon capture and sequestration) and solar radiation management (SRM) (as shown, for example, by the introduction of aerosols into the atmosphere to reflect incoming solar radiation). The authors of the paper reviewed here flag several indirect references to CDR in the Paris agreement as well as suggesting the inevitability of SRM, if there is any chance of meeting the very challenging objective of limiting warming to 1.5 C or less. They noted that CDR comes with a high short term cost while SRM does not but could limit warming to 1.5 C- although SRM comes with much more uncertainty when it comes to side effects and governance issues.
To see Key Quotes and Links to key reports about this post, click HERE
Filed under: Environmental Plans | Tagged: climate, emissions | Leave a comment »
Posted on September 29, 2016 by pollutionfree
Potential for widespread electrification of personal vehicle travel in the United States (Abstract, Zachary A. Needell, James McNerney, Michael T. Chang & Jessika E. Trancik, Nature Energy, Aug. 15, 2016)
Also discussed here: Today’s electric vehicles can make a dent in climate change: Electric vehicles can meet drivers’ needs enough to replace 90 percent of vehicles now on the road (Science Daily, Aug. 15, 2016)
And here: Low-carbon infrastructure strategies for cities (Abstract, C. A. Kennedy, N. Ibrahim & D. Hoornweg, Nature climate change, Mar.16,2014)
Today we review research into the feasibility of widespread use of e-cars for urban transportation. Results indicate that 87% of current needs can easily be met by today’s electric vehicle technology, noting the obstacles that are holding back their full acceptance can or will be overcome. The need to charge batteries can be done overnight or during the day in parking facilities. The relative short driving range can be overcome for driving long distances by utilizing alternatives such as car-sharing with conventional vehicles or by purchasing a second car for those needs. Converting 90% of today’s vehicles to electric power would reduce greenhouse gas emissions for the USA by 30% – or more if power came from utilities with lower carbon fuel use.

To see Key Quotes and Links to key reports about this post, click HERE
Filed under: Urban Traffic | Tagged: emissions, traffic, transportation | Leave a comment »
Posted on September 26, 2016 by pollutionfree
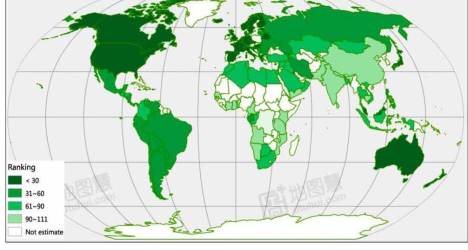
A Global Perspective on the Sustainable Performance of Urbanization (16 page pdf, Liyin Shen, Chenyang Shuai, Liudan Jiao, Yongtao Tan and Xiangnan Song, Sustainability, Aug. 11, 2016)
Today we review a comparison of 111 countries, according to how well they perform in urban sustainability, made up of indices of environmental, economic and social sustainability. The best overall performers are developed countries in Western Europe, the worst in Africa and Asia. It is notable that although Sweden is not the top performer in any one of the three indices, it is the best overall, signaling how well that country balances the three aspects.
To see Key Quotes and Links to key reports about this post, click HERE
Filed under: Standards/Regulations | Tagged: health, pollution, standards, transportation | Leave a comment »
Posted on September 22, 2016 by pollutionfree
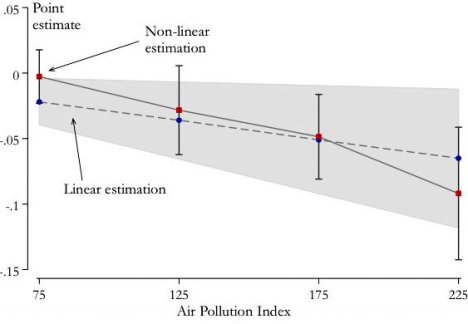
The Effect of Pollution on Worker Productivity: Evidence from Call-Center Workers in China (Abstract, Tom Chang, Joshua Graff Zivin, Tal Gross, Matthew Neidell, NBER Working Paper No. 22328, Jun. 2016)
Also discussed here: The effect of pollution on worker productivity: Evidence from call-centre workers in China (Tom Chang, Tal Gross, Joshua Graff Zivin, Matthew Neidell, VOX- CEPR’s Policy Portal, Jul. 15, 016)
And here:Pollution is bad for your health, but is it also making you less productive? (Tal Gross, Tom Chang, Joshua Graff Zivin, Matthew Neidell, World Economic Forum, Jul. 25, 2016)
Today we review research that looks at how the productivity of call workers in China was affected by higher levels of pollution. Results indicate that a 10% increase in the Air Pollution Index (API) was associated with a 0.3% drop in calls handled each day. Translated to China’s office workers as a whole, a 10% improvement in air pollution equates to $2.2 Billion/year in productivity. Or, to put it in a big city North American context (Los Angeles), were the 90 days that pollution levels exceeded EPA standards eliminated, the productivity for that city alone would be $378 greater. As the authors comment in terms of broader implications, pollution restrictions, aimed at an improved environment, are sometimes seen as a negative, unfair “tax” by businesses. This paper shows that it could help rather than hinder their bottom line.
To see Key Quotes and Links to key reports about this post, click HERE
Filed under: Health Impacts | Tagged: economic, health, pollution | Leave a comment »
Posted on September 20, 2016 by pollutionfree
Long-term air pollution exposure and lung function in 15 year-old adolescents living in an urban and rural area in Germany: The GINIplus and LISAplus cohorts (Abstract, Elaine Fuertes, Johannes Bracher , Claudia Flexeder , Iana Markevych , Claudia Klümper, Barbara Hoffmann , Ursula Krämer, Andrea von Berg , Carl-Peter Bauer , Sibylle Koletzko , Dietrich Berdel, Joachim Heinrich, Holger Schulz, International Journal of Hygiene and Environmental Health, Mar. 2015)
Today we review research that tries to answer the question of whether exposure to traffic-related air pollution by children has both a short term and long term effect on their lung development. Results indicate that while no link was found between long term exposure on lung development, that those who had asthma did show a link with long term exposure to NO2. It was also observed that the impact of short term exposure may be reversible later in their lives.
http://www.gettyimages.com/detail/116477411
To see Key Quotes and Links to key reports about this post, click HERE
Filed under: Health Impacts, Urban Traffic | Tagged: health, traffic | Leave a comment »
Posted on September 15, 2016 by pollutionfree
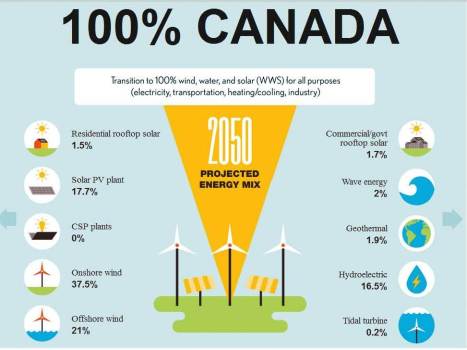
100% Clean and Renewable Wind, Water, and Sunlight (WWS) All-Sector Energy Roadmaps for 139 Countries of the World (62 page pdf, Mark Z. Jacobson, Mark A. Delucchi, Zack A.F. Bauer, Savannah C. Goodman, William E. Chapman, Mary A. Cameron, Alphabetical: Cedric Bozonnat, Liat Chobadi, Jenny R. Erwin, Simone N. Fobi, Owen K. Goldstrom, Sophie H. Harrison, Ted M. Kwasnik, Jonathan Lo, Jingyi Liu, Chun J. Yi, Sean B. Morris, Kevin R. Moy, Patrick L. O’Neill, Stephanie Redfern, Robin Schucker, Mike A. Sontag, Jingfan Wang, Eric Weiner, Alex S. Yachanin, Stanford University, Apr. 24, 2016)
Also discussed here: Clean Energy Could Fuel Most Countries by 2050, Study Shows (Zahra Hirji, InsideClimate News, Niv. 27, 2015)
Today we review a draft report prepared for the 2015 UN Climate Conference in Paris that provides an analysis of the ways that renewable energy source could be applied in 139 countries to replace the carbon sources currently used. Currently, only 3.8% of the power capacity is installed to reach 100% clean energy worldwide. In Canada, as an example, a power load of 412.1 gigawatts is required by 2050 under a business as usual scenario . Under a clean energy scenario, however, the country would need only 240.2 gigawatts of power. Most of the energy would come from onshore and offshore wind (58%), utility-scale and rooftop solar (21%), hydropower (16.5 %) and a mix of other sources, including geothermal (2%) and wave energy. The avoided health costs would be $107.6B per year which represents 4% of GDP or 9,598 air pollution deaths avoided every year. The estimated total electricity, health and climate cost savings of this transition would amount to about $8,887 per Canadian per year (in 2013 dollars).
To see Key Quotes about this post, click HERE
Filed under: Environmental Plans, Health Impacts | Tagged: climate, future, health | Leave a comment »
Posted on September 13, 2016 by pollutionfree
Long-Term Exposure to Air Pollution and Increased Risk of Membranous Nephropathy in China (Abstract, Xin Xu, Guobao Wang, Nan Chen†, Tao Lu*, Sheng Nie*, Gang Xu‡, Ping Zhang§, Yang Luo‖, Yongping Wang*, Xiaobin Wang¶, Joel Schwartz**, Jian Geng††‡‡ and Fan Fan Hou, Journal of the American Society of Nephrology, Jun. 30, 2016)
Also discussed here: Air pollution linked to increased rates of kidney disease – Regions in China with high levels of fine particulate air pollution have elevated rates of membranous nephropathy (Science Daily, Jun. 30, 2016)
Today we review research on the impact of particulate matter (average annual PM2.5 in the range 6 to 114 μg/m3) on the risk of developing membranous nephropathy (MN), an immune disorder of the kidneys that can lead to kidney failure. Results showed that MN increased 13% over in the eleven year period.

To see Key Quotes, click HERE
Filed under: Health Impacts | Tagged: health, particulates | Leave a comment »